Measured: iPhone 18 Pro microphone frequency response and directivity
Frequency Response
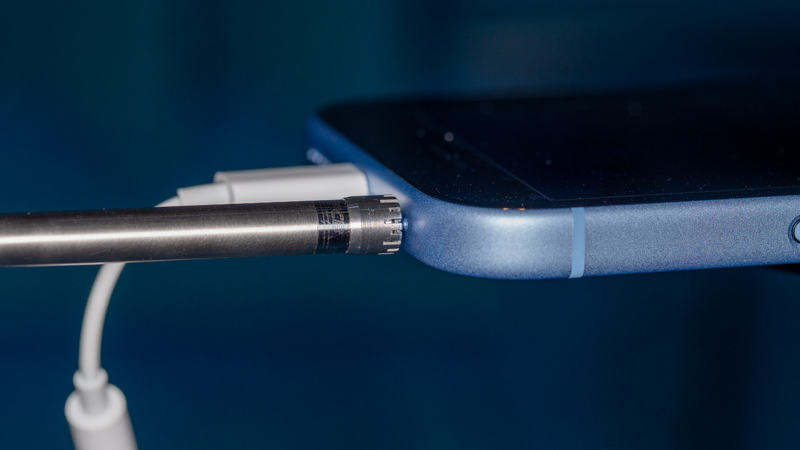
I measured the frequency response of the iPhone 18 Pro microphone by positioning a lab-grade reference microphone (PCB model 377C01 connected to model 426A14 phantom-powered preamp) 0.5 mm away from the phone (facing the mic) in our anechoic chamber. The reference mic was connected directly to input 1 of an RME ADI-2 Pro FS R dual channel USB interface (A Mackie phantom power supply was used to power the mic preamp). The iPhone microphone signal was routed directly to a USB-C to 3.5mm headphone adapter using SignalScope’s audio play through function (with measurement mode enabled) and from there to input 2 of the ADI-2 Pro. The response between the 2 microphones was measured with SignalScope’s Dual FFT Analyzer (on a Mac) with the microphones facing toward and away from a loudspeaker which was generating a swept sine excitation signal. The 2-microphone arrangement was rotated 180 degrees between measurements and the individual measurements were then averaged. The average measurement was corrected with the factory-supplied frequency response of the reference microphone for both pressure and free-field acoustic sensitivity. The graph, below was generated with SignalScope.
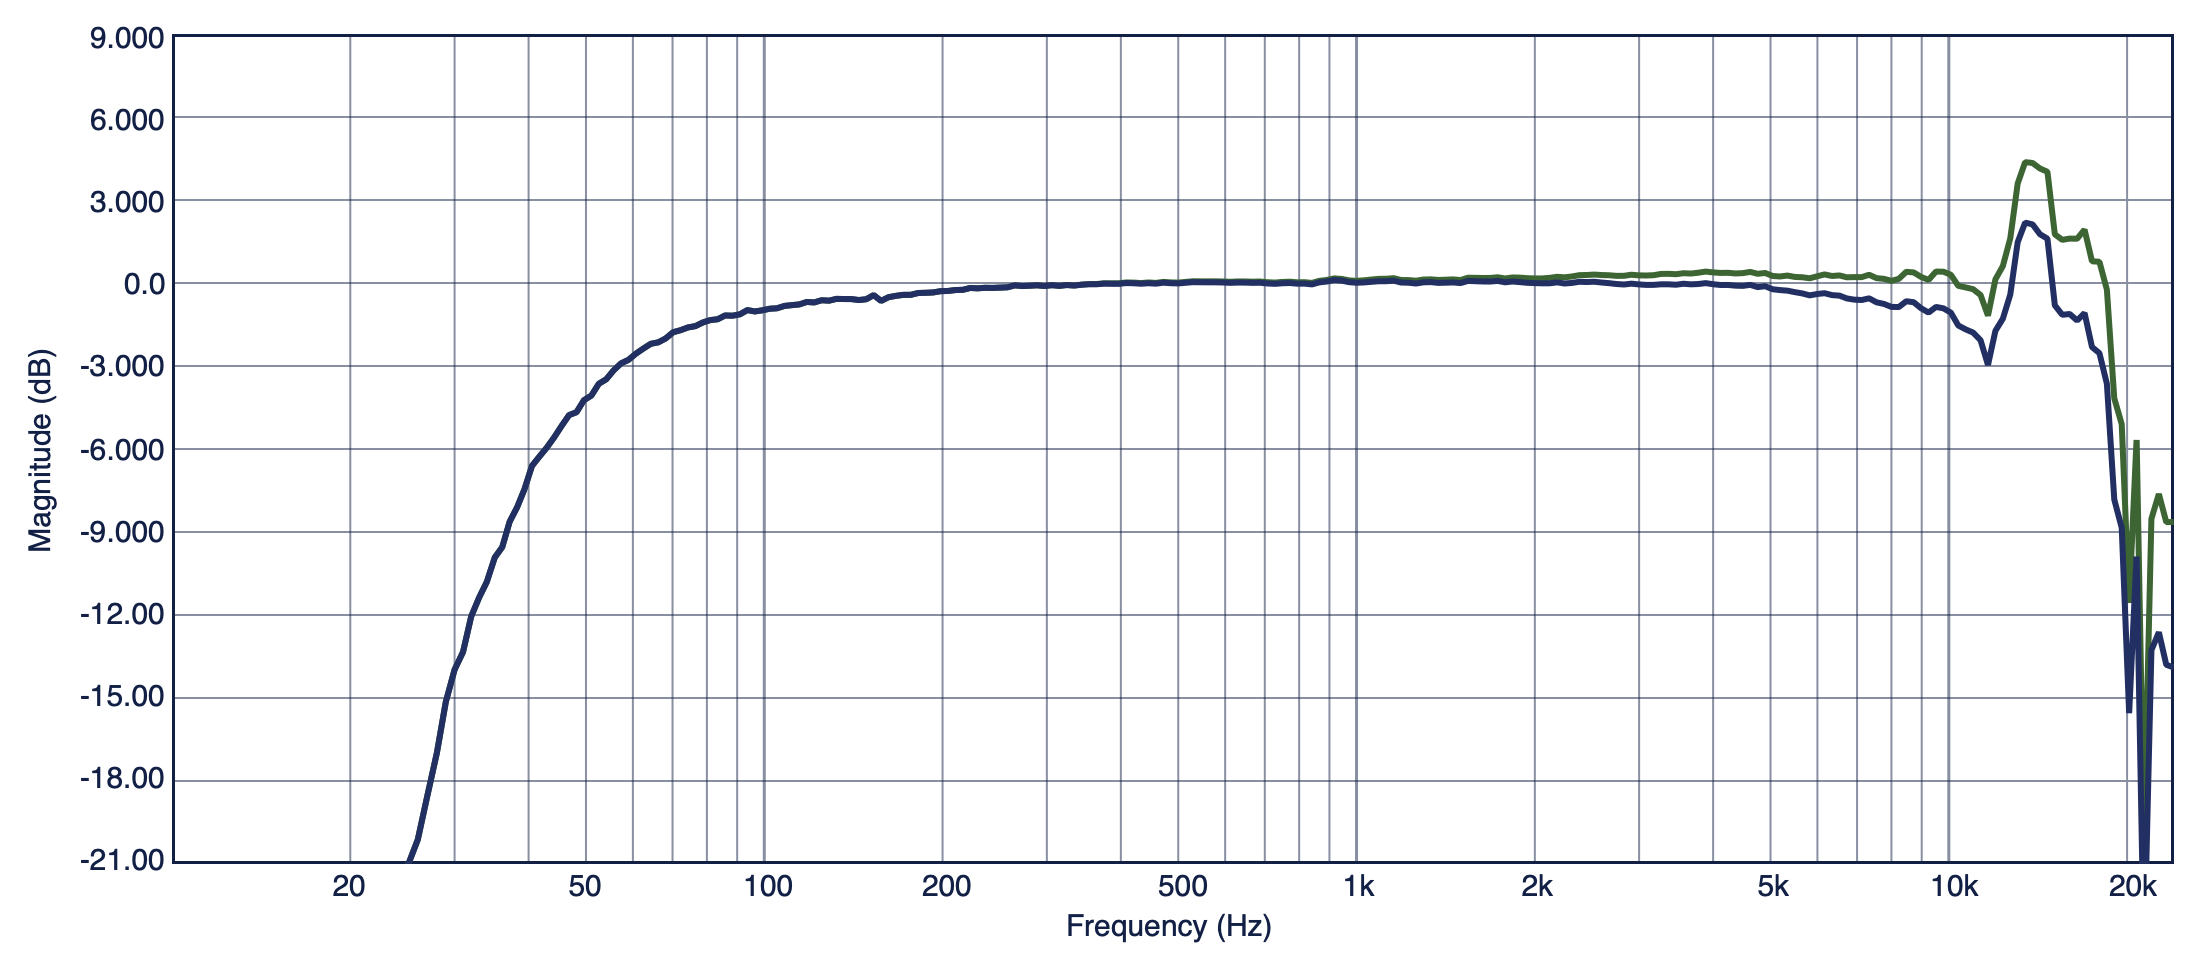
This year, I switch to a 1/4″ reference microphone for the iPhone measurements, since a 1/4″ mic more closely matches the thickness of the iPhone itself than the 1/2″ microphone used previously. This makes more sense for direct comparison between the 2 microphones and, indeed, the difference between the measurements made at different orientations was considerably smaller than for the iPhone 17 Pro measured with the 1/2″ mic.
Directivity
For directivity, 1/3-octave sound levels were measured as the phone was rotated around its microphone at 1.5 degree increments. A single, full-range, coaxial-driver loudspeaker generated the broadband test signal that ran for the duration of the measurements. Spectra in all resulting measurements were then accessed to generate a set of polar data for each frequency band. Several of these polar data sets were loaded into SignalScope’s Polar Plot tool to generate the graph, below.
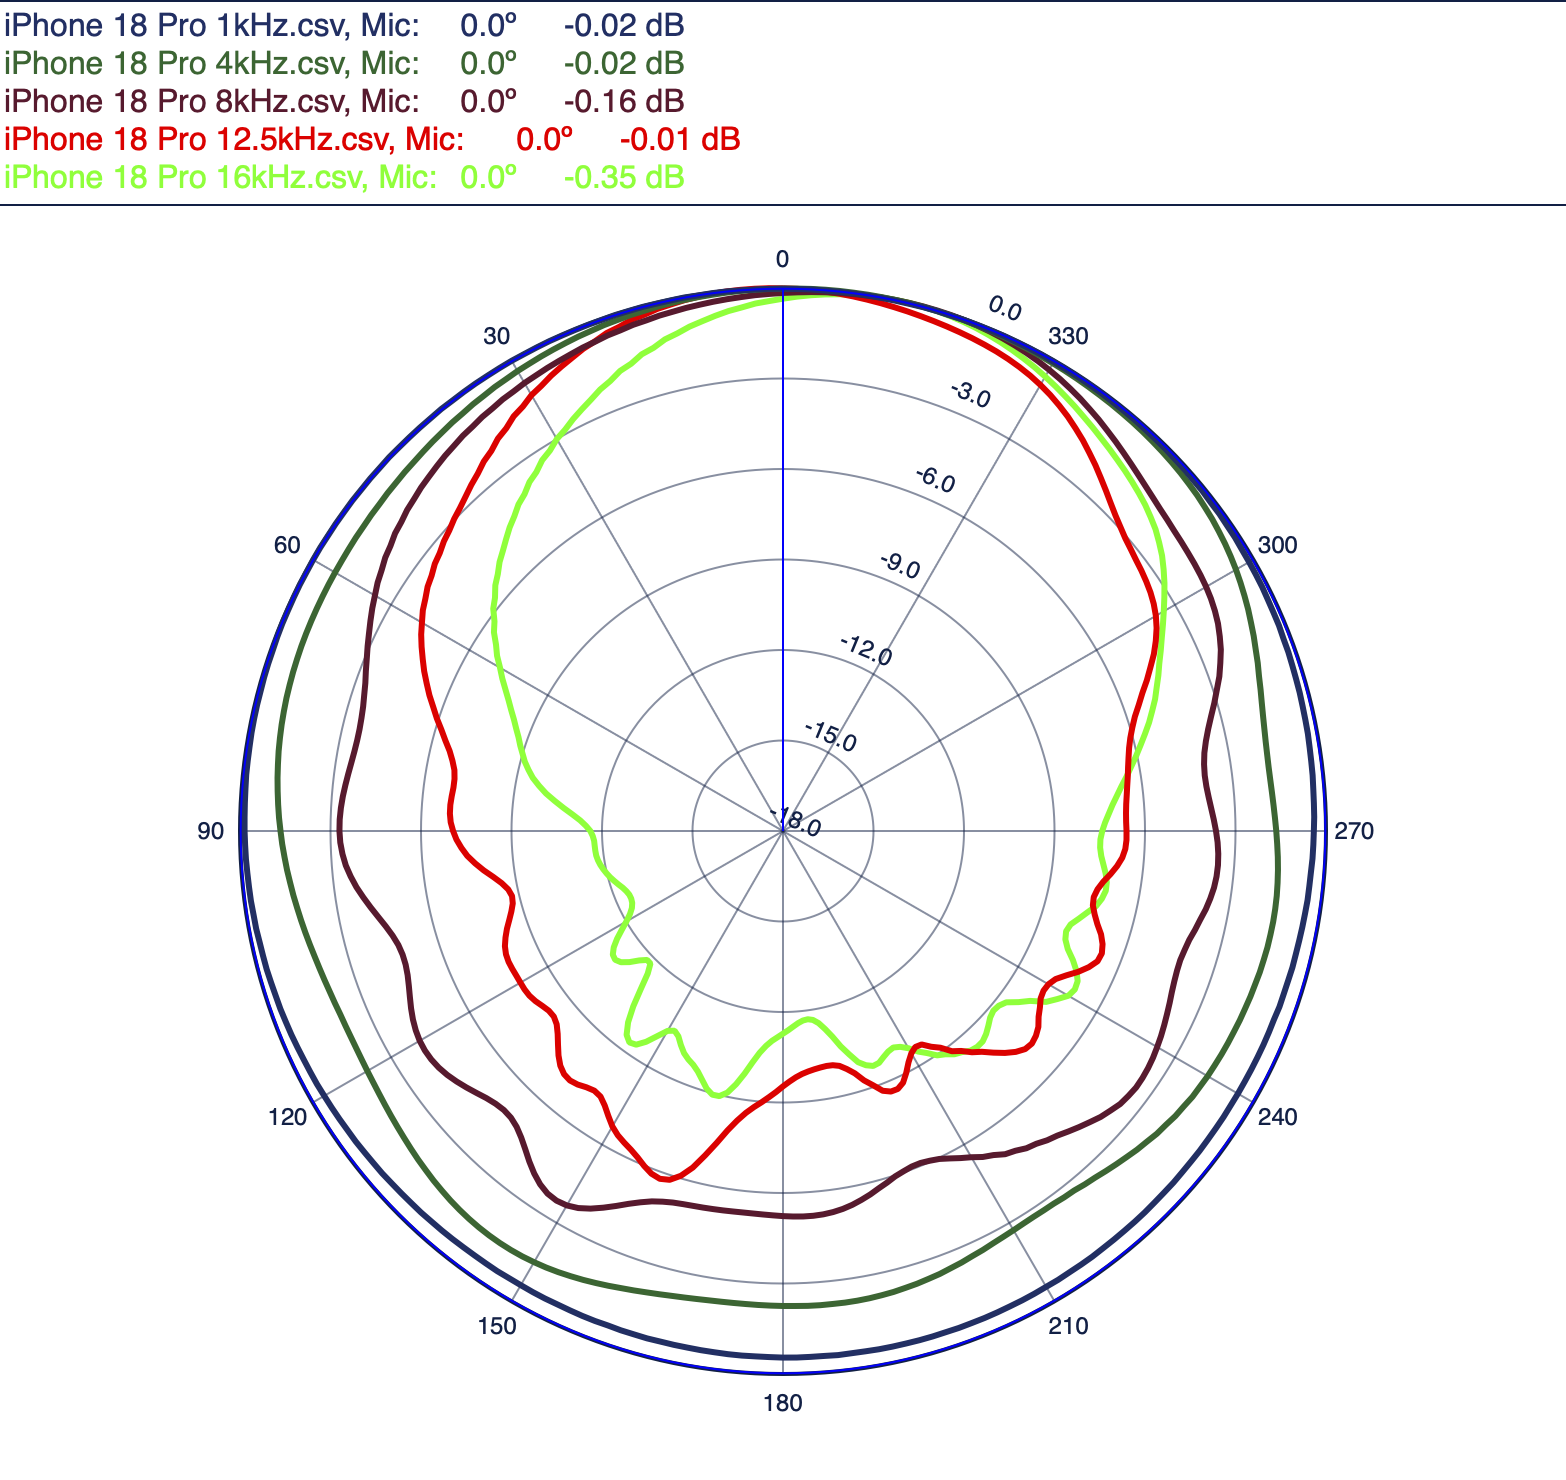
Note: 1/24-octave smoothing is applied to the frequency response data. No smoothing is applied to the polar plot data.